출처: https://developers.google.com/web/tools/chrome-devtools/network-performance/reference#timing
network 요청들 리뷰
By default, DevTools records all network requests in the Network panel, so long as DevTools is open.
Stop recording network requests
To stop recording requests:
- Click Stop recording network log
 on the Network panel. It turns grey to indicate that DevTools is no longer recording requests.
 - Press Command+E (Mac) or Control+E (Windows, Linux) while the Network panel is in focus.
Clear requests
Click Clear

on the Network panel to clear all requests from the Requests table.

Figure 2
Save requests across page loads
To save requests across page loads, check the Preserve log checkbox on the Network panel. DevTools saves all requests until you disable Preserve log.
로그 유지는 다음 페이지로 넘어가더라도, 기존 페이지의 로그를 보면서 모니터링이 가능합니다.페이지 이동시 로그가 없어질때, 이 선택박스를 체크해주면 유용합니다.

Figure 3
Capture screenshots during page load (해당기능 없어짐)
Capture screenshots to analyze what users see as they wait for your page to load.
To enable screenshots, click Capture screenshots

on the Network panel. It turns blue when enabled.
Reload the page while the Network panel is in focus to capture screenshots.
Once captured, you can interact with screenshots in the following ways:
- Hover over a screenshot to view the point at which that screenshot was captured. A yellow line appears on the Overview pane.
- Click a screenshot's thumbnail to filter out any requests that occurred after the screenshot was captured.
- Double-click a thumbnail to zoom in on it.

Figure 4
Replay XHR request
To replay an XHR request, right-click the request in the Requests table and select Replay XHR.

Figure 5
Change loading behavior
Emulate a first-time visitor by disabling the browser cache
To emulate how a first-time user experiences your site, check the Disable cache checkbox. DevTools disables the browser cache. This more accurately emulates a first-time user's experience, because requests are served from the browser cache on repeat visits.

Figure 6
Disable the browser cache from the Network Conditions drawer
If you want to disable the cache while working in other DevTools panels, use the Network Conditions drawer.
- Open the Network Conditions drawer.
- Check or uncheck the Disable cache checkbox.
Manually clear the browser cache
To manually clear the browser cache at any time, right-click anywhere in the Requests table and select Clear Browser Cache.

Figure 7
Emulate offline
There's a new class of web apps, called Progressive Web Apps, which can function offline with the help of service workers. When you're building this type of app, it's useful to be able to quickly simulate a device that has no data connection.
Check the Offline checkbox to simulate a completely offline network experience.

Figure 8
Emulate slow network connections
Emulate 2G, 3G, and other connection speeds from the Network Throttling menu.

Figure 9
You can select from a variety of presets, such as Regular or Good 2G. You can also add your own custom presets by opening the Network Throttling menu and selecting Custom > Add.
DevTools displays a warning icon next to the Network tab to remind you that throttling is enabled.
Emulate slow network connections from the Network Conditions drawer
If you want to throttle the network connection while working in other DevTools panels, use the Network Conditions drawer.
- Open the Network Conditions drawer.
- Select your desired connection speed from the Network Throttling menu.
Manually clear browser cookies
To manually clear browser cookies at any time, right-click anywhere in the Requests table and select Clear Browser Cookies.

Figure 10
Override the user agent
To manually override the user agent:
- Open the Network Conditions drawer.
- Uncheck Select automatically.
- Choose a user agent option from the menu, or enter a custom one in the text box.
Filter requests
Filter requests by properties
Use the Filter text box to filter requests by properties, such as the domain or size of the request.
If you can't see the text box, the Filters pane is probably hidden. See Hide the Filters pane.

Figure 11
You can use multiple properties simultaneously by separating each property with a space. For example, mime-type:image/gif larger-than:1K displays all GIFs that are larger than one kilobyte. These multi-property filters are equivalent to AND operations. OR operations are currently not supported.
Below is a complete list of supported properties.
domain. Only display resources from the specified domain. You can use a wildcard character (*) to include multiple domains. For example,*.comdisplays resources from all domain names ending in.com. DevTools populates the autocomplete dropdown menu with all of the domains it has encountered.has-response-header. Show the resources that contain the specified HTTP response header. DevTools populates the autocomplete dropdown with all of the response headers that it has encountered.is. Useis:runningto findWebSocketresources.larger-than. Show resources that are larger than the specified size, in bytes. Setting a value of1000is equivalent to setting a value of1k.method. Show resources that were retrieved over a specified HTTP method type. DevTools populates the dropdown with all of the HTTP methods it has encountered.mime-type. Show resources of a specified MIME type. DevTools populates the dropdown with all MIME types it has encountered.mixed-content. Show all mixed content resources (mixed-content:all) or just the ones that are currently displayed (mixed-content:displayed).scheme. Show resources retrieved over unprotected HTTP (scheme:http) or protected HTTPS (scheme:https).set-cookie-domain. Show the resources that have aSet-Cookieheader with aDomainattribute that matches the specified value. DevTools populates the autocomplete with all of the cookie domains that it has encountered.set-cookie-name. Show the resources that have aSet-Cookieheader with a name that matches the specified value. DevTools populates the autocomplete with all of the cookie names that it has encountered.set-cookie-value. Show the resources that have aSet-Cookieheader with a value that matches the specified value. DevTools populates the autocomplete with all of the cookie values that it has encountered.status-code. Only show resources whose HTTP status code match the specified code. DevTools populates the autocomplete dropdown menu with all of the status codes it has encountered.
Filter requests by type
To filter requests by request type, click the XHR, JS, CSS, Img, Media, Font, Doc, WS (WebSocket), Manifest, or Other (any other type not listed here) buttons on the Network panel.
If you can't see these buttons, the Filters pane is probably hidden. See Hide the Filters pane.
To enable multiple type filters simultaneously, hold
Command
(Mac) or
Control
(Windows, Linux) and then click.
![Using the Type filters to display JS, CSS, and Doc[ument]
resources.](https://developers.google.com/web/tools/chrome-devtools/network-performance/imgs/multi-type-filter.png)
Figure 12
Filter requests by time
Click and drag left or right on the Overview pane to only display requests that were active during that time frame. The filter is inclusive. Any request that was active during the highlighted time is shown.

Figure 13
Hide data URLs
Data URLs are small files embedded into other documents. Any request that you see in the Requests table that starts with data: is a data URL.
Check the Hide data URLs checkbox to hide these requests.

Figure 14
Sort requests
By default, the requests in the Requests table are sorted by initiation time, but you can sort the table using other criteria.
Sort by column
Click the header of any column in the Requests to sort requests by that column.
Sort by activity phase
To change how the Waterfall sorts requests, right-click the header of the Requests table, hover over Waterfall, and select one of the following options:
- Start Time. The first request that was initiated is at the top.
- Response Time. The first request that started downloading is at the top.
- End Time. The first request that finished is at the top.
- Total Duration. The request with the shortest connection setup and request / response is at the top.
- Latency. The request that waited the shortest time for a response is at the top.
These descriptions assume that each respective option is ranked from shortest to longest. Clicking on the Waterfall column's header reverses the order.

Figure 15
Analyze requests
So long as DevTools is open, it logs all requests in the Network panel. Use the Network panel to analyze requests.
View a log of requests
Use the Requests table to view a log of all requests made while DevTools has been open. Clicking or hovering over requests reveals more information about them.

Figure 16
The Requests table displays the following columns by default:
- Name. The filename of, or an identifier for, the resource.
- Status. The HTTP status code.
- Type. The MIME type of the requested resource.
- Initiator. The following objects or processes can initiate requests:
- Parser. Chrome's HTML parser.
- Redirect. An HTTP redirect.
- Script. A JavaScript function.
- Other. Some other process or action, such as navigating to a page via a link or entering a URL in the address bar.
- Size. The combined size of the response headers plus the response body, as delivered by the server.
- Time. The total duration, from the start of the request to the receipt of the final byte in the response.
- Waterfall. A visual breakdown of each request's activity.
Add or remove columns
Right-click the header of the Requests table and select an option to hide or show it. Currently displayed options have checkmarks next to them.

Figure 17
Add custom columns
To add a custom column to the Requests table, right-click the header of the Requests table and select Response Headers > Manage Header Columns.

Figure 18
View the timing of requests in relation to one another
Use the Waterfall to view the timing of requests in relation to one another. By default, the Waterfall is organized by the start time of the requests. So, requests that are farther to the left started earlier than those that are farther to the right.
See Sort by activity phase to see the different ways that you can sort the Waterfall.

Figure 19
Analyze the frames of a WebSocket Connection
To view the frames of a WebSocket connection:
- Click the URL of the WebSocket connection, under the Name column of the Requests table.
- Click the Frames tab. The table shows the last 100 frames.
To refresh the table, re-click the name of the WebSocket connection under the Name column of the Requests table.

Figure 20
The table contains three columns:
- Data. The message payload. If the message is plain text, it's displayed here. For binary opcodes, this column displays the opcode's name and code. The following opcodes are supported: Continuation Frame, Binary Frame, Connection Close Frame, Ping Frame, and Pong Frame.
- Length. The length of the message payload, in bytes.
- Time. The time when the message was received or sent.
Messages are color-coded according to their type:
- Outgoing text messages are light-green.
- Incoming text messages are white.
- WebSocket opcodes are light-yellow.
- Errors are light-red.
View a preview of a response body
To view a preview of a response body:
- Click the URL of the request, under the Name column of the Requests table.
- Click the Preview tab.
This tab is mostly useful for viewing images.

Figure 21
View a response body
To view the response body to a request:
- Click the URL of the request, under the Name column of the Requests table.
- Click the Headers tab.

Figure 22
View HTTP headers
To view HTTP header data about a request:
- Click on the URL of the request, under the Name column of the Requests table.
- Click the Headers tab.

Figure 23
View HTTP header source
By default, the Headers tab shows header names alphabetically. To view the HTTP header names in the order they were received:
- Open the Headers tab for the request you're interested in. See View HTTP headers.
- Click view source, next to the Request Header or Response Header section.
View query string parameters
To view the query string parameters of a URL in a human-readable format:
- Open the Headers tab for the request you're interested in. See View HTTP headers.
- Go to the Query String Parameters section.

Figure 24
View query string parameters source
To view the query string parameter source of a request:
- Go to the Query String Parameters section. See View query string parameters.
- Click view source.
View URL-encoded query string parameters
To view query string parameters in a human-readable format, but with encodings preserved:
- Go to the Query String Parameters section. See View query string parameters.
- Click view URL encoded.
View cookies
To view the cookies sent in a request's HTTP header:
- Click the URL of the request, under the Name column of the Requests table.
- Click the Cookies tab.
See Fields for a description of each of the columns.

Figure 25
View the timing breakdown of a request
To view the timing breakdown of a request:
- Click the URL of the request, under the Name column of the Requests table.
- Click the Timing tab.
See Preview a timing breakdown for a faster way to access this data.
See Timing breakdown phases explained for more information about each of the phases that you may see in the Timing tab.

Figure 26
Here's more information about each of the phases.
See View timing breakdown for another way to access this view.
Preview a timing breakdown
To view a preview of the timing breakdown of a request, hover over the request's entry in the Waterfallcolumn of the Requests table.
See View the timing breakdown of a request for a way to access this data that does not require hovering.

Figure 27
Timing breakdown phases explained
Here's more information about each of the phases you may see in the Timing tab:
- Queueing. The browser queues requests when:
- There are higher priority requests.
- There are already six TCP connections open for this origin, which is the limit. Applies to HTTP/1.0 and HTTP/1.1 only.
- Stalled. The request could be stalled for any of the reasons described in Queueing.
- DNS Lookup. The browser is resolving the request's IP address.
- Proxy negotiation. The browser is negotiating the request with a proxy server.
- Request sent. The request is being sent.
- ServiceWorker Preparation. The browser is starting up the service worker.
- Request to ServiceWorker. The request is being sent to the service worker.
- Waiting (TTFB). The browser is waiting for the first byte of a response. TTFB stands for Time To First Byte.
- Content Download. The browser is receiving the response.
View initiators and dependencies
To view the initiators and dependencies of a request, hold
Shift
and hover over the request in the Requests table. DevTools colors initiators green, and dependencies red.

Figure 28
When the Requests table is ordered chronologically, the first green request above the request that you're hovering over is the initiator of the dependency. If there's another green request above that, that higher request is the initiator of the initiator. And so on.
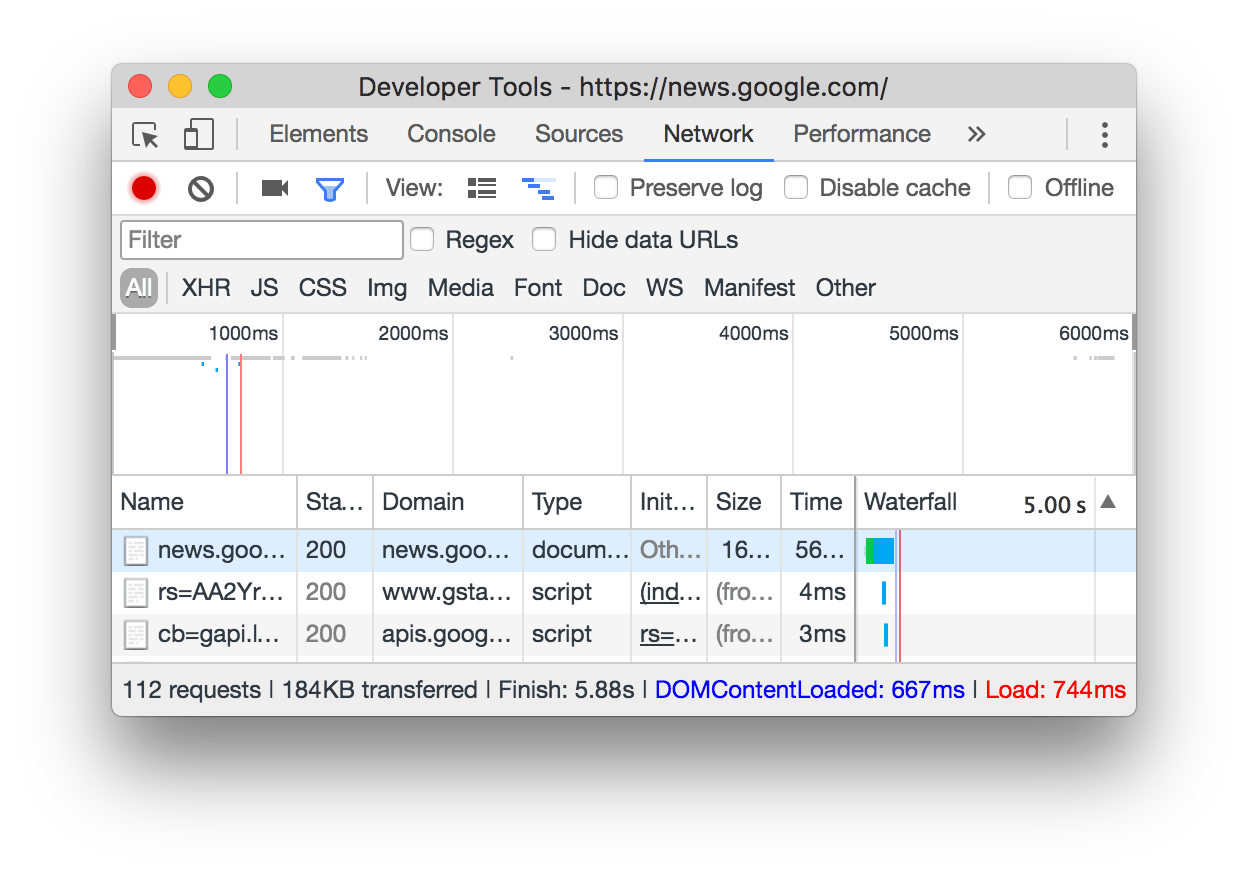
View load events
DevTools displays the timing of the DOMContentLoaded and load events in multiple places on the Network panel. The DOMContentLoaded event is colored blue, and the load event is red.

Figure 29
DOMContentLoaded
load
View the total number of requests
The total number of requests is listed in the Summary pane, at the bottom of the Network panel.

Figure 30
View the total download size
The total download size of requests is listed in the Summary pane, at the bottom of the Network panel.

Figure 31
Export requests data
Save a request as HAR with content
To save a request in the HAR format with content:
- Right-click the row containing the request in the Requests table.
- Select Save as HAR with Content.

Figure 32
Copy one or more requests to the clipboard
Under the Name column of the Requests table, right-click a request, hover over Copy, and select one of the following options:
- Copy Link Address. Copy the request's URL to the clipboard.
- Copy Response. Copy the response body to the clipboard.
- Copy as cURL. Copy the request as a cURL command.
- Copy All as cURL. Copy all requests as a chain of cURL commands.
- Copy All as HAR. Copy all requests as HAR data.

Figure 33
Change the layout of the Network panel
Expand or collapse sections of the Network panel UI to focus on what's important to you.
Hide the Filters pane
By default, DevTools shows the Filters pane. Click Filter

to hide it.

Figure 34
Use large request rows
By default, DevTools uses small rows in the Requests pane. Click Use large request rows

to use large rows, instead.

Figure 35

Figure 36

Figure 37
Hide the Overview pane (해당 기능 없어짐)
By default, DevTools shows the Overview pane. Click Hide overview

to hide it.

Figure 38
'Web' 카테고리의 다른 글
| 네이버 - 웹 표준 최적화 기본 가이드 ( SEO ) (0) | 2018.09.14 |
|---|---|
| facebook live stream 동영상(mp4) 다운로드 받기 (0) | 2017.09.29 |
| RESTFul 이란 CRUD => POST/GET/PUT/DELETE (0) | 2017.09.20 |
| Mobile Photo Gallery Web app 만들기 (0) | 2017.08.18 |
| IE11 - IE11의 호환성 변경 (0) | 2014.03.05 |
| [펌] 나눔명조, 나눔명조Bold 웹폰트 WOFF, EOT폰트 (0) | 2014.01.17 |
| pixel & point (픽셀과 포인트) (0) | 2013.01.26 |
| div 안에 image 정중앙 놓기 (0) | 2013.01.10 |
(로그인하지 않으셔도 가능)